

Spreadsheets, Meh-sheets: Making "Walking-Around" Knowledge Accessible
What I learned about bridging the gap between where students were and where I thought they were, plus a mini-lesson on spreadsheets


I taught a statistics class for the MBA students once. Unlike most undergraduates, graduate students read the syllabus.
On the syllabus, I said they should have basic-level ability on Excel. I didn’t detail this. But what I meant was and should have said was this:
Students should know where the columns (labelled alphabetically—A, B, C, and so on) and the rows (labelled numerically. 1, 2, 3 and so on) were and how to add a label like A1 to a function. Students should also have some familiarity with functions.
One student, let’s call her Ann, came into my office worried. She was a branch manager for a local credit union. “I have a secretary who handles my spreadsheets for me. I haven’t worked with them in years.” I told her not to worry, what we were doing was easy stuff.
After Ann came in, I assumed that everyone was no worse off than she was. Everyone in an MBA program had a business degree? Right?
Before I get to what I learned, I’m not going to assume this of you. If you know Excel upside down and inside out, skip this section. If you don’t, read on.
A mini lesson on spreadsheets
Spreadsheets store information. MS Excel and Google Sheets are the most popular ones, and I’ll use the notation they use.
If you’ve signed up for a challenge on Substack, like
’s notes challenge or added your name to a list of subscribers for marketing campaigns, you’ve seen a spreadsheet.But most of us use them for number crunching. I add up spending for budgeting. I use Excel to keep track of my spending on certain categories. But I used Google Sheets for another project.
These spreadsheets look alike. Both programs lay out data in columns and rows. Here are screenshots of the both layouts:


Cells are where you add information. Each cell has a label. In this case, A1 gives you an instruction that lets you see the dropdown menu. But usually the label refers to the information in that cell. The information can be a name, a title, a category, or a number.
If the information is a number other than a breakout category, it’s data that can be added and averaged. Words that refer to information within a category can be data too.
For example, if you’re looking at assorted color options, you’d store the data as the name of the color, with addition information about how many people bought this color of an item, like a shirt or paint color.
For example, I used Google Sheets to keep track of my words during the summer. (I got sick in June which explains my poor start.) Then I tallied the weekly totals in cells I2, I3, and I4, as shown below:
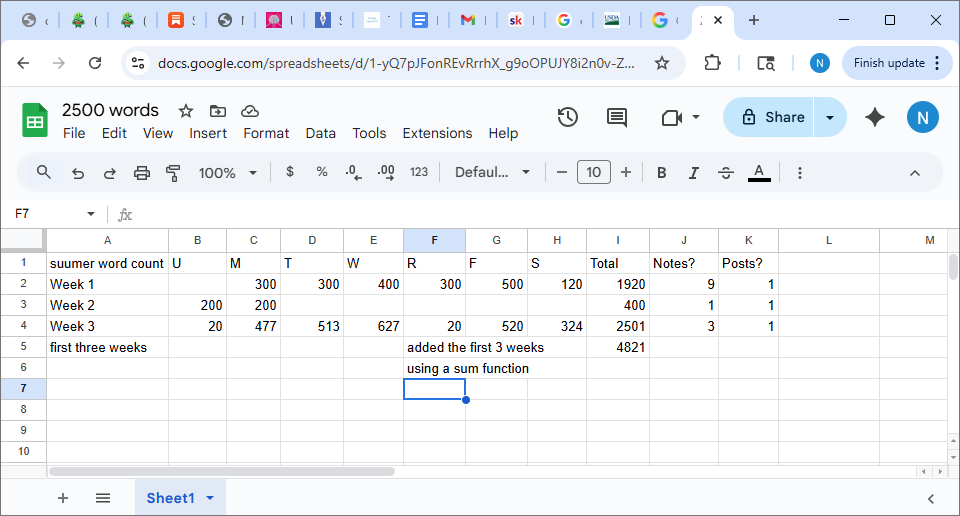
Then I totaled the three weeks in cell I5. The words in cells A2, A3, and A4 also have information. They tell me the week. Cells B1 through H1 tell me the day of the week.
Some numerical data isn’t so easy to work with, especially if there are a lot of numbers, so we use functions, like mode (the most common), and highest and lowest in a range. I could use this to find out what the median word count for my posts, for example.
With that in mind, you can see where my assumptions about student knowledge got in the way.
Lessons learned
On the first day, I ask them to pull up Excel and put in some numbers I had on the screen to the A column (where I have titles above). Then we started playing around with basic statistics like averages, medians, and ranges.
Except I was working in the G (where you’ll see 500, nothing, and 520 above) column. I didn’t think about it, just told them to convert my Gs to As.
(Poor planning on my part—I should have stored everything in the A column.)
I thought everyone was fine. They all understood what I meant and were working away. I also thought they were all business school graduates, so they’d know Excel.
I was wrong.
There was another student, let’s call her Ellen, in the MBA class. She was there not because of her business background, but because she had a degree from a prestigious university. She’d never heard of Excel because she was a history major.
Ann told me about it later. “I felt relieved that at least I knew what A1 was. Ellen was confused most of the class, but I helped her.”
Ann and I both learned something that day. Ann learned that by helping someone else, she found out that she was better with spreadsheets than she thought and she understood the lesson better.
I learned to make sure everyone who was in my classroom was on the same page.
The lesson also applies to those who read my work. If they’re not on the same page, then they won’t get what I’m trying to say. Just as a newbie to Google Sheets might not get what I gained from teaching MBA students.
(Which is why I added the mini lesson.)
Thanks to
for the idea. She’s not to blame for what I did with it!Thanks for reading.
Nikki
I also love spreadsheets :D Thanks for adding me, Nikki